Traffic Count and Vehicle Classification
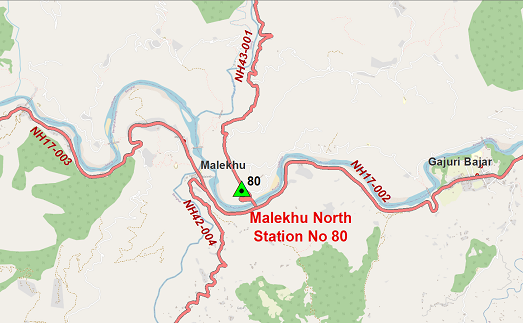
Malekhu North
Summary of Traffic Count
| Station No |
Road Link |
Location |
AADT |
AADT excluding MC & Rickshaws |
AADT in PCUs |
AADT in PCUs excluding MC & Rickshaws |
Year |
More info |
| 80 |
F03401 |
Malekhu North |
584 |
381 |
751 |
650 |
2011/12 |
view detail |
80 |
F03401 |
Malekhu North |
880 |
437 |
956 |
735 |
2012/13 |
view detail |
80 |
F03401 |
Malekhu North |
1162 |
566 |
1286 |
989 |
2014/15 |
view detail |
80 |
F03401 |
Malekhu North |
888 |
460 |
1000 |
786 |
2015/16 |
view detail |
80 |
F03401 |
Malekhu North |
1502 |
831 |
1949 |
1614 |
2016/17 |
view detail |
80 |
F03401 |
Malekhu North |
2073 |
1015 |
2197 |
1668 |
2018/19 |
view detail |
80 |
NH43-001 |
Malekhu North |
1825 |
848 |
1947 |
1458 |
2020/21 |
view detail |
80 |
NH43-001 |
Malekhu North |
1827 |
826 |
2009 |
1509 |
2021/22 |
view detail |
80 |
NH43-001 |
Malekhu North |
1796 |
809 |
1877 |
1383 |
2022/23 |
view detail |
80 |
NH43-001 |
Malekhu North |
2175 |
961 |
2309 |
1702 |
2024/25 |
view detail |
×
![]()
Detail of the Manual Vehicle Count of location Malekhu North
Year: 2015/16Road Link: F03401Seasonal Variation Factor used for the month March: 0.91
Station No: 80Location: Malekhu North
| Date |
Start Time (Hrs) |
Motorized Vehicle |
Non-motorized Vehicle |
Total |
| Truck |
Bus |
Car |
Motor Cycle |
Utility Vehicle |
Tractor |
Motorized Three Wheeler |
Four Wheel Drive |
Power Tiller |
Rickshaw |
Bullock Cart/ Hand Cart/ Tanga |
| Multi Axle |
Heavy |
Light |
Big |
Mini |
Micro |
| a |
b |
a |
b |
a |
b |
a |
b |
a |
b |
a |
b |
a |
b |
a |
b |
a |
b |
a |
b |
a |
b |
a |
b |
a |
b |
a |
b |
a |
b |
a |
b |
Total |
| 2016-03-28 |
00:00:00 |
|
|
|
|
|
|
|
|
|
|
|
|
|
|
|
|
|
|
|
|
|
|
|
|
|
|
|
|
|
|
0 |
0 |
0 |
| 2016-03-28 |
01:00:00 |
|
|
|
|
|
|
|
|
|
|
|
|
|
|
1 |
|
|
|
|
|
|
|
|
|
|
|
|
|
|
|
1 |
0 |
1 |
| 2016-03-28 |
02:00:00 |
|
|
2 |
|
|
|
|
|
|
|
|
|
|
|
|
|
|
|
|
|
|
|
1 |
|
|
|
|
|
|
|
3 |
0 |
3 |
| 2016-03-28 |
03:00:00 |
|
|
|
|
|
|
|
|
|
|
|
|
|
|
|
|
|
|
|
|
|
|
|
|
|
|
|
|
|
|
0 |
0 |
0 |
| 2016-03-28 |
04:00:00 |
|
|
1 |
|
|
|
|
|
|
|
|
|
|
|
1 |
|
|
1 |
|
|
|
|
|
|
|
|
|
|
|
|
2 |
1 |
3 |
| 2016-03-28 |
05:00:00 |
|
|
|
|
2 |
|
|
|
|
|
|
|
|
|
|
|
|
|
|
|
|
|
1 |
|
|
|
|
|
|
|
3 |
0 |
3 |
| 2016-03-28 |
06:00:00 |
|
|
3 |
3 |
1 |
|
|
|
4 |
|
2 |
2 |
1 |
|
4 |
3 |
2 |
|
1 |
1 |
|
|
1 |
|
|
|
|
|
|
|
19 |
9 |
28 |
| 2016-03-28 |
07:00:00 |
|
|
|
1 |
1 |
|
|
|
1 |
|
8 |
4 |
|
|
18 |
2 |
1 |
|
1 |
|
|
|
4 |
3 |
|
|
|
|
|
|
34 |
10 |
44 |
| 2016-03-28 |
08:00:00 |
|
|
1 |
|
2 |
2 |
|
|
4 |
2 |
5 |
3 |
3 |
|
15 |
18 |
|
|
4 |
|
|
|
2 |
1 |
|
|
|
|
|
|
36 |
26 |
62 |
| 2016-03-28 |
09:00:00 |
|
2 |
9 |
1 |
1 |
2 |
6 |
6 |
3 |
4 |
2 |
2 |
3 |
9 |
23 |
6 |
1 |
3 |
4 |
11 |
|
|
14 |
|
|
|
|
|
|
|
66 |
46 |
112 |
| 2016-03-28 |
10:00:00 |
|
|
3 |
5 |
|
1 |
1 |
4 |
6 |
8 |
5 |
12 |
2 |
6 |
26 |
13 |
|
|
5 |
6 |
|
|
5 |
7 |
|
|
|
|
|
|
53 |
62 |
115 |
| 2016-03-28 |
11:00:00 |
|
1 |
|
|
2 |
2 |
|
1 |
1 |
3 |
5 |
3 |
5 |
4 |
13 |
7 |
1 |
|
2 |
|
|
|
3 |
|
|
|
|
|
|
|
32 |
21 |
53 |
| 2016-03-28 |
12:00:00 |
|
|
3 |
|
3 |
4 |
|
|
3 |
3 |
1 |
|
|
2 |
|
24 |
|
|
3 |
1 |
|
|
2 |
1 |
|
|
|
|
|
|
15 |
35 |
50 |
| 2016-03-28 |
13:00:00 |
1 |
|
|
|
2 |
3 |
2 |
1 |
|
|
7 |
2 |
|
4 |
23 |
|
|
|
1 |
1 |
|
|
2 |
|
|
|
|
|
|
|
38 |
11 |
49 |
| 2016-03-28 |
14:00:00 |
1 |
1 |
|
|
1 |
3 |
2 |
|
2 |
5 |
5 |
9 |
1 |
2 |
20 |
28 |
1 |
|
|
1 |
|
|
|
1 |
|
|
|
|
|
|
33 |
50 |
83 |
| 2016-03-28 |
15:00:00 |
|
|
1 |
|
6 |
1 |
|
|
1 |
4 |
7 |
8 |
|
|
33 |
27 |
|
|
1 |
2 |
|
|
1 |
1 |
|
|
|
|
|
|
50 |
43 |
93 |
| 2016-03-28 |
16:00:00 |
|
|
2 |
1 |
3 |
|
|
|
|
6 |
7 |
6 |
|
2 |
17 |
26 |
1 |
4 |
2 |
2 |
|
|
3 |
|
|
|
|
|
|
|
35 |
47 |
82 |
| 2016-03-28 |
17:00:00 |
|
|
1 |
|
1 |
3 |
|
|
1 |
4 |
3 |
3 |
2 |
3 |
28 |
13 |
1 |
|
1 |
|
|
|
|
1 |
|
|
|
|
|
|
38 |
27 |
65 |
| 2016-03-28 |
18:00:00 |
1 |
2 |
|
|
|
1 |
|
|
6 |
1 |
2 |
1 |
3 |
2 |
8 |
3 |
|
2 |
1 |
1 |
|
|
1 |
2 |
|
|
|
|
|
|
22 |
15 |
37 |
| 2016-03-28 |
19:00:00 |
|
|
|
1 |
|
2 |
|
1 |
2 |
3 |
2 |
1 |
3 |
|
3 |
17 |
|
1 |
1 |
|
|
|
|
1 |
|
|
|
|
|
|
11 |
27 |
38 |
| 2016-03-28 |
20:00:00 |
1 |
|
|
|
1 |
1 |
|
|
|
|
2 |
1 |
2 |
1 |
5 |
10 |
|
|
|
1 |
|
|
1 |
1 |
|
|
|
|
|
|
12 |
15 |
27 |
| 2016-03-28 |
21:00:00 |
|
|
1 |
1 |
|
1 |
|
|
|
2 |
|
4 |
|
|
11 |
7 |
|
|
|
1 |
|
|
1 |
1 |
|
|
|
|
|
|
13 |
17 |
30 |
| 2016-03-28 |
22:00:00 |
|
|
1 |
|
|
|
|
|
|
1 |
1 |
|
1 |
1 |
3 |
7 |
|
|
|
|
|
|
|
1 |
|
|
|
|
|
|
6 |
10 |
16 |
| 2016-03-28 |
23:00:00 |
|
|
|
|
|
|
|
|
|
|
|
|
|
|
|
2 |
|
|
|
|
|
|
|
|
|
|
|
|
|
|
0 |
2 |
2 |
| Day 1 Sub-total click to view/hide in hour |
4 |
6 |
28 |
13 |
26 |
26 |
11 |
13 |
34 |
46 |
64 |
61 |
26 |
36 |
252 |
213 |
8 |
11 |
27 |
28 |
0 |
0 |
42 |
21 |
0 |
0 |
0 |
0 |
0 |
0 |
522 |
474 |
996 |
| 2016-03-29 |
00:00:00 |
|
|
|
|
|
|
|
|
|
|
|
|
|
|
|
|
|
|
|
|
|
|
|
|
|
|
|
|
|
|
0 |
0 |
0 |
| 2016-03-29 |
01:00:00 |
|
|
|
|
|
|
|
|
|
|
|
|
|
|
|
|
|
|
|
|
|
|
|
|
|
|
|
|
|
|
0 |
0 |
0 |
| 2016-03-29 |
02:00:00 |
|
|
|
|
|
|
|
|
|
|
|
|
|
|
|
|
|
|
|
|
|
|
|
|
|
|
|
|
|
|
0 |
0 |
0 |
| 2016-03-29 |
03:00:00 |
|
|
1 |
|
|
|
|
|
|
|
|
|
|
|
|
|
|
|
|
|
|
|
|
|
|
|
|
|
|
|
1 |
0 |
1 |
| 2016-03-29 |
04:00:00 |
|
|
|
|
1 |
|
|
|
|
|
|
|
|
|
|
|
|
|
|
|
|
|
|
|
|
|
|
|
|
|
1 |
0 |
1 |
| 2016-03-29 |
05:00:00 |
|
|
2 |
1 |
|
|
|
|
|
|
|
|
|
|
|
|
|
1 |
|
|
|
|
|
1 |
|
|
|
|
|
|
2 |
3 |
5 |
| 2016-03-29 |
06:00:00 |
|
1 |
|
1 |
|
1 |
|
|
|
1 |
5 |
2 |
1 |
1 |
5 |
9 |
|
|
2 |
3 |
|
|
|
|
|
|
|
|
|
|
13 |
19 |
32 |
| 2016-03-29 |
07:00:00 |
|
|
1 |
|
2 |
|
|
|
|
|
3 |
4 |
|
|
7 |
5 |
|
|
|
|
|
|
|
2 |
|
|
|
|
|
|
13 |
11 |
24 |
| 2016-03-29 |
08:00:00 |
|
|
2 |
2 |
3 |
1 |
|
|
3 |
2 |
4 |
3 |
3 |
|
16 |
11 |
3 |
1 |
3 |
2 |
|
|
3 |
3 |
|
|
|
|
|
|
40 |
25 |
65 |
| 2016-03-29 |
09:00:00 |
|
|
1 |
|
5 |
4 |
|
|
2 |
7 |
8 |
12 |
5 |
3 |
24 |
19 |
1 |
|
2 |
1 |
|
|
2 |
1 |
|
|
|
|
|
|
50 |
47 |
97 |
| 2016-03-29 |
10:00:00 |
|
|
2 |
|
|
1 |
2 |
|
1 |
3 |
2 |
3 |
2 |
2 |
21 |
24 |
|
|
2 |
|
|
|
2 |
1 |
|
|
|
|
|
|
34 |
34 |
68 |
| 2016-03-29 |
11:00:00 |
|
|
|
|
2 |
3 |
|
1 |
2 |
8 |
6 |
5 |
|
2 |
15 |
24 |
|
|
3 |
1 |
|
|
1 |
1 |
|
|
|
|
|
|
29 |
45 |
74 |
| 2016-03-29 |
12:00:00 |
|
1 |
2 |
1 |
1 |
2 |
2 |
|
5 |
3 |
2 |
7 |
2 |
1 |
18 |
27 |
1 |
3 |
1 |
2 |
|
|
|
|
|
|
|
|
|
|
34 |
47 |
81 |
| 2016-03-29 |
13:00:00 |
|
2 |
|
|
1 |
2 |
3 |
|
3 |
2 |
3 |
5 |
2 |
3 |
16 |
11 |
1 |
|
|
|
|
|
1 |
2 |
|
|
|
|
|
|
30 |
27 |
57 |
| 2016-03-29 |
14:00:00 |
|
|
1 |
1 |
|
|
2 |
|
4 |
2 |
5 |
3 |
2 |
2 |
26 |
20 |
|
4 |
|
|
|
|
3 |
|
|
|
|
|
|
|
43 |
32 |
75 |
| 2016-03-29 |
15:00:00 |
|
|
|
|
2 |
6 |
1 |
|
6 |
5 |
2 |
7 |
1 |
2 |
28 |
24 |
|
|
|
|
|
|
2 |
5 |
|
|
|
|
|
|
42 |
49 |
91 |
| 2016-03-29 |
16:00:00 |
|
|
|
1 |
4 |
|
|
1 |
3 |
3 |
3 |
3 |
2 |
1 |
6 |
18 |
|
|
1 |
3 |
|
|
3 |
1 |
1 |
|
|
|
|
|
23 |
31 |
54 |
| 2016-03-29 |
17:00:00 |
|
1 |
|
|
1 |
|
|
|
4 |
1 |
4 |
6 |
5 |
1 |
27 |
4 |
|
3 |
1 |
1 |
|
|
|
5 |
|
|
|
|
|
|
42 |
22 |
64 |
| 2016-03-29 |
18:00:00 |
1 |
|
1 |
|
2 |
|
|
|
2 |
1 |
8 |
4 |
3 |
|
26 |
6 |
|
|
|
1 |
|
|
|
2 |
|
|
|
|
|
|
43 |
14 |
57 |
| 2016-03-29 |
19:00:00 |
|
2 |
1 |
|
|
1 |
|
|
3 |
|
1 |
2 |
2 |
2 |
6 |
2 |
2 |
1 |
3 |
1 |
|
|
5 |
|
|
|
|
|
|
|
23 |
11 |
34 |
| 2016-03-29 |
20:00:00 |
|
|
1 |
|
|
|
|
|
|
|
|
2 |
1 |
|
8 |
12 |
|
2 |
4 |
|
|
|
3 |
|
|
|
|
|
|
|
17 |
16 |
33 |
| 2016-03-29 |
21:00:00 |
|
|
2 |
|
1 |
2 |
|
|
|
|
2 |
|
|
|
8 |
6 |
|
|
|
1 |
|
|
1 |
|
|
|
|
|
|
|
14 |
9 |
23 |
| 2016-03-29 |
22:00:00 |
|
|
|
|
1 |
|
|
|
|
|
4 |
|
|
1 |
|
2 |
|
|
1 |
|
|
|
|
|
|
|
|
|
|
|
6 |
3 |
9 |
| 2016-03-29 |
23:00:00 |
|
|
|
|
|
|
|
|
|
|
|
|
|
|
|
|
|
|
|
|
|
|
|
|
|
|
|
|
|
|
0 |
0 |
0 |
| Day 2 Sub-total click to view/hide in hour |
1 | 7 | 17 | 7 | 26 | 23 | 10 | 2 | 38 | 38 | 62 | 68 | 31 | 21 | 257 | 224 | 8 | 15 | 23 | 16 | 0 | 0 | 26 | 24 | 1 | 0 | 0 | 0 | 0 | 0 |
500 |
445 |
945 |
| 2016-03-30 |
00:00:00 |
|
|
|
|
|
|
|
|
|
|
|
|
|
|
|
|
|
|
|
|
|
|
|
|
|
|
|
|
|
|
0 |
0 |
0 |
| 2016-03-30 |
01:00:00 |
|
|
|
|
|
|
|
|
|
|
|
|
|
|
|
|
|
|
|
|
|
|
|
|
|
|
|
|
|
|
0 |
0 |
0 |
| 2016-03-30 |
02:00:00 |
|
|
|
|
|
|
|
|
|
|
|
|
|
|
1 |
|
|
|
|
|
|
|
|
|
|
|
|
|
|
|
1 |
0 |
1 |
| 2016-03-30 |
03:00:00 |
|
|
2 |
|
1 |
|
|
|
|
|
|
|
|
|
|
|
|
|
|
|
|
|
|
|
|
|
|
|
|
|
3 |
0 |
3 |
| 2016-03-30 |
04:00:00 |
|
|
|
|
2 |
|
|
|
|
|
|
|
|
|
|
|
|
|
|
|
|
|
2 |
|
|
|
|
|
|
|
4 |
0 |
4 |
| 2016-03-30 |
05:00:00 |
|
|
1 |
|
|
|
|
|
|
|
|
|
|
|
1 |
|
1 |
|
|
|
|
|
|
|
|
|
|
|
|
|
3 |
0 |
3 |
| 2016-03-30 |
06:00:00 |
|
|
1 |
2 |
2 |
|
|
|
1 |
1 |
10 |
3 |
1 |
1 |
11 |
12 |
|
1 |
|
|
|
|
2 |
2 |
|
|
|
|
|
|
28 |
22 |
50 |
| 2016-03-30 |
07:00:00 |
|
|
|
|
1 |
2 |
|
|
|
|
4 |
5 |
|
1 |
12 |
17 |
1 |
3 |
2 |
|
1 |
1 |
5 |
3 |
|
1 |
|
|
|
|
26 |
33 |
59 |
| 2016-03-30 |
08:00:00 |
|
1 |
1 |
|
4 |
1 |
|
|
8 |
3 |
4 |
5 |
2 |
2 |
7 |
24 |
3 |
|
1 |
3 |
|
|
3 |
4 |
|
|
|
|
|
|
33 |
43 |
76 |
| 2016-03-30 |
09:00:00 |
|
|
3 |
|
2 |
|
|
1 |
3 |
5 |
2 |
3 |
3 |
1 |
3 |
5 |
7 |
|
1 |
|
1 |
|
2 |
2 |
|
|
|
|
|
|
27 |
17 |
44 |
| 2016-03-30 |
10:00:00 |
|
|
5 |
2 |
|
1 |
|
4 |
1 |
|
5 |
2 |
|
1 |
4 |
27 |
2 |
|
6 |
2 |
|
|
1 |
1 |
|
1 |
|
|
|
|
24 |
41 |
65 |
| 2016-03-30 |
11:00:00 |
|
|
2 |
2 |
1 |
3 |
|
|
2 |
6 |
7 |
5 |
3 |
|
18 |
23 |
7 |
|
4 |
1 |
|
|
|
1 |
|
|
|
|
|
|
44 |
41 |
85 |
| 2016-03-30 |
12:00:00 |
|
2 |
1 |
|
|
2 |
2 |
|
2 |
6 |
1 |
6 |
1 |
2 |
16 |
27 |
5 |
2 |
1 |
3 |
|
|
|
2 |
|
|
|
|
|
|
29 |
52 |
81 |
| 2016-03-30 |
13:00:00 |
1 |
2 |
|
2 |
1 |
1 |
1 |
|
|
3 |
1 |
6 |
5 |
3 |
4 |
25 |
|
|
3 |
1 |
|
|
|
3 |
|
|
|
|
|
|
16 |
46 |
62 |
| 2016-03-30 |
14:00:00 |
|
|
2 |
5 |
1 |
|
|
|
4 |
6 |
4 |
4 |
3 |
1 |
9 |
15 |
|
1 |
2 |
2 |
|
|
|
6 |
|
|
|
|
|
|
25 |
40 |
65 |
| 2016-03-30 |
15:00:00 |
2 |
|
2 |
|
3 |
3 |
|
|
5 |
1 |
4 |
7 |
4 |
1 |
21 |
11 |
7 |
|
1 |
|
|
|
|
|
|
|
|
|
|
|
49 |
23 |
72 |
| 2016-03-30 |
16:00:00 |
|
|
1 |
|
|
|
|
|
3 |
4 |
6 |
10 |
7 |
5 |
27 |
24 |
|
1 |
1 |
3 |
|
|
1 |
4 |
|
|
|
|
|
|
46 |
51 |
97 |
| 2016-03-30 |
17:00:00 |
|
|
|
1 |
2 |
1 |
|
|
4 |
|
2 |
2 |
5 |
4 |
|
37 |
3 |
1 |
3 |
1 |
|
|
2 |
2 |
|
|
|
|
|
|
21 |
49 |
70 |
| 2016-03-30 |
18:00:00 |
|
2 |
1 |
3 |
1 |
|
|
|
2 |
|
3 |
2 |
2 |
|
8 |
10 |
|
|
1 |
3 |
|
|
|
1 |
|
|
|
|
|
|
18 |
21 |
39 |
| 2016-03-30 |
19:00:00 |
|
1 |
|
|
|
|
|
|
4 |
2 |
3 |
1 |
|
2 |
8 |
7 |
2 |
|
|
1 |
|
|
|
|
|
|
|
|
|
|
17 |
14 |
31 |
| 2016-03-30 |
20:00:00 |
|
|
2 |
|
|
1 |
|
|
|
|
2 |
1 |
1 |
|
3 |
14 |
|
|
2 |
|
|
|
|
|
|
|
|
|
|
|
10 |
16 |
26 |
| 2016-03-30 |
21:00:00 |
|
|
1 |
|
1 |
|
|
|
|
1 |
1 |
|
2 |
|
13 |
6 |
1 |
|
2 |
2 |
|
|
1 |
|
|
|
|
|
|
|
22 |
9 |
31 |
| 2016-03-30 |
22:00:00 |
|
|
|
|
1 |
|
|
|
|
2 |
|
|
1 |
1 |
3 |
9 |
|
|
|
|
|
|
|
3 |
|
|
|
|
|
|
5 |
15 |
20 |
| 2016-03-30 |
23:00:00 |
|
|
|
|
|
|
|
|
|
|
|
|
|
|
|
4 |
|
|
|
|
|
|
|
|
|
|
|
|
|
| Day 3 Sub-total click to view/hide in hour |
3 |
8 |
25 |
17 |
23 |
15 |
3 |
5 |
39 |
40 |
59 |
62 |
40 |
25 |
169 |
297 |
39 |
9 |
30 |
22 |
2 |
1 |
19 |
34 |
0 |
2 |
0 |
0 |
0 |
0 |
451 |
537 |
988 |
| Total |
8 |
21 |
70 |
37 |
75 |
64 |
24 |
20 |
111 |
124 |
185 |
191 |
97 |
82 |
678 |
734 |
55 |
35 |
80 |
66 |
2 |
1 |
87 |
79 |
1 |
2 |
0 |
0 |
0 |
0 |
1473 |
1456 |
2929 |
| Grand Total |
29 |
107 |
139 |
44 |
235 |
376 |
179 |
1412 |
90 |
146 |
3 |
166 |
3 |
0 |
0 |
2929 |
2929 |
| Average Daily Traffic (ADT) |
10 |
36 |
46 |
15 |
78 |
125 |
60 |
471 |
30 |
49 |
1 |
55 |
1 |
0 |
0 |
976 |
976 |
| Composition (%) |
1% |
4% |
5% |
2% |
8% |
13% |
6% |
48% |
3% |
5% |
0% |
6% |
0% |
0% |
0% |
100% |
100% |
| Total ADT Exc. MC & Rickshaw |
506 |
| Composition Exc. MC & Rickshaw(%) |
2% |
7% |
9% |
3% |
15% |
25% |
12% |
- |
6% |
10% |
0% |
11% |
0% |
- |
0% |
100% |
100% |
| Average Annual Daily Traffic(AADT) |
9 |
32 |
42 |
13 |
71 |
114 |
54 |
428 |
27 |
44 |
1 |
50 |
1 |
0 |
0 |
888 |
| AADT Exc. MC & Rickshaw |
9 |
32 |
42 |
13 |
71 |
114 |
54 |
- |
27 |
44 |
1 |
50 |
1 |
- |
0 |
460 |
| PCU Factors |
4 |
3 |
1.5 |
3 |
2.5 |
1.5 |
1 |
0.5 |
1 |
1.5 |
0.75 |
1 |
1.5 |
1 |
2 |
|
| AADT in PCUs |
36 |
96 |
63 |
39 |
178 |
171 |
54 |
214 |
27 |
66 |
1 |
50 |
2 |
0 |
0 |
996 |
| AADT in PCUs Exc. MC & Rickshaw |
36 |
96 |
63 |
39 |
177.5 |
171 |
54 |
- |
27 |
66 |
0.75 |
50 |
1.5 |
- |
0 |
782 |
Note:
Average PCU/Vehicle factor= 1
Average PCU/Vehicle factor (excl. MC & Rickshaws)= 1.7
copyright Department of Roads, Nepal (DOR)